
The global average temperature for April was 1.13C above the 10 year average reference period 1961 – 1990

The Monthly data show a small decrease in temperatures since the peak El Nino with a temperature anomaly of 1.13 C, well below the record value of 1.5C in 2023.

Monthly temperature anomaly data since
The data show a small continued decrease from the peak El Nino in 2023.


The methods now employed to measure temperature (the German BodenTemperatur scandal for example, and the manipulation of raw data by agencies like the Australian Bureau of Meteorology – See ) throw into question whether, in fact, there has been a rise in temperature in recent times, or whether this was simply the result of a different temperature measuring regime. Whatever, the temperature is now falling and all proxy data show CO2 has never had an appreciable effect on the earth’s atmospheric temperature. It has also been much warmer in the last 8,000 years than now. (See
 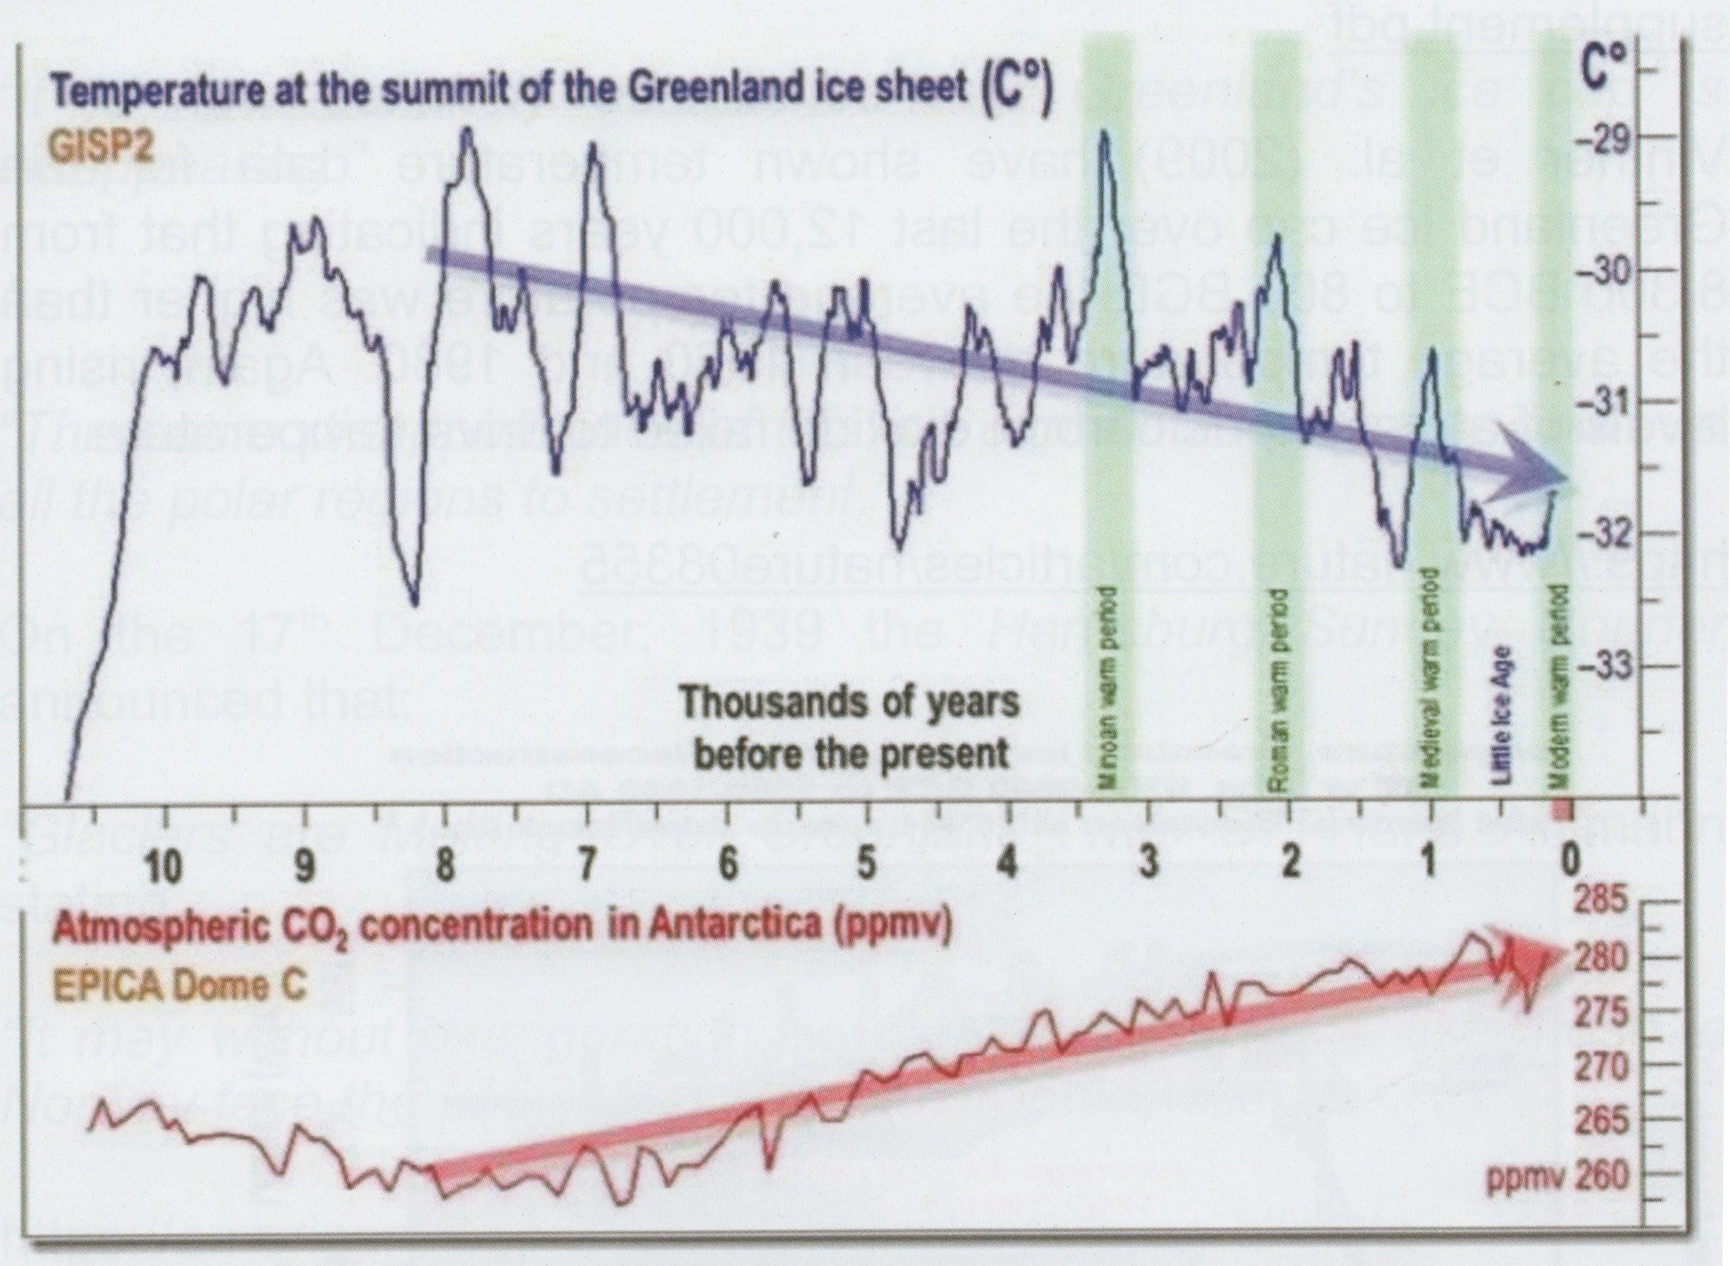 )
)
Anthropogenic Global Warming is one huge scam designed to beggar Western economies and impoverish the people therein whilst enriching the world’s elite; the end beneficiary of this nonsense being the Chinese Communist Party.
Yes – It’s called “Data Homogenisation”
Any result which disagrees with the consensus needs correction by definition !
So if temperature is a dependant variable and CO2 is climbing, why is the temperature falling
Because science is more complex. Climate Science as a simple function of CO2 is wrong as it mixes up cause and effect.
Hi Clive, I know nothing about the science of the impending global apocalyptic inevitability being forced on us all but I have done my own ‘research’ I would welcome your opinion on.
I looked into the ‘hockey stick’ and saw that the above apocalyptic inevitability is based on tree rings? I mean seriously ?
So, I thought to myself how long have we had accurate temperature readings and it seems that it was Mr Fahrenheit who came up with mercury which is apparently accurate to 0.5 degrees which seems a little more accurate than tree rings ??
And then I discovered the the Central England temperature thing that has been recording temperature in the UK to a 0.5 degree accuracy since 1772. Not a tree ring in sight.
So I put the raw data from that into chat GPT and came up with my own graph (not the one ‘promoted/skewed’ by met office) which I can’t attach but it does show an increase since 1950.
But there again, UK population in 1950 was 20 MILLION people less than it is today AND when I google the difference between rural and urban temperatures it says this can be up to 7 degrees.
Where is the fault in my logic ? And why is the central England temperature not used more ?
Hi Steve,
Yes the Hockey stick has been strongly criticised and it mostly is no longer used.
The older temperature data is mostly concentrated in US, UK , Europe etc. The CET data does indeed shows little warming see:
https://clivebest.com/blog/?p=7319
We also have the urban heat effect for the early data. I do think the global data is more believable once we have sufficient global coverage with wide coverage of SST data
The early SST data are based on individual shipping data based on buckets of water thrown over the side !
The Met Office use their automated weather station data but you can still isolate the CET data from them.
Clearly there is an urban heat effect.
Since we normally complain about British weather – a bit of warming must be an improvement !
You are right. Of course it you deforest say the UK, then it will have an effect on surface temperature, rainfall etc. It also obvious that “run away”become extinct. warming is also nonsense since if true we would have already