
Abstract: A consistent method to measure the decadal trend of global temperatures is described. This is based on the geometry of a level 4 icosahedral grid. The fixed geometry allows us to integrate over a 10 year period for each bin and then measure the decadal average temperature anomaly on a 1961-1990 baseline. The decadal average is a smooth function of time which cleanly integrates short term effects like El Nino. This then allows us to directly measure the transient climate response (TCR), defined as the temperature increase on a doubling of CO2 from pre-industrial levels. The result for TCR is 2.9 ± 0.2C and also predicts that the Paris Agreement will be breached in 2032.
The largest uncertainty in the effects of climate change is an accurate measurement of the sensitivity of the earth’s temperature to increasing CO2 levels (climate sensitivity). This is usually defined as the increase in the global temperature following a doubling of CO2 levels (560ppm). If the sensitivity is high ( > 3C ) then severe action now could be justified despite the negative economic consequences, if such action would then avoid even worse economic disruption if ignored. However if instead Climate Sensitivity is lower ( < 3C) then we have sufficient time to plan an effective future energy transition based around nuclear power and renewables, thereby maintaining living standards for the longer term.
To answer this dilema the key question then is whether we can accurately measure the value for transient climate response (TCR) from the current global temperature data? The accepted answer to this currently is that we can’t rely on a single year’s temperature because the value is also affected by natural cycles such as el Nino, the North Atlantic Oscillation and volcanic eruptions. Despite this many climate scientists and activists often assume the worst case scenario based on a single year’s weather extremes to push for immediate curbs on fossil fuels as a precautionary measure. Instead we present here a direct way to measure the earth’s climate sensitivity which avoids these natural short term climate effects. This method is based on the geometry of Icosahedral grids which can represent any spherical object such as the earth in a consistent and stable way. This then allows us to integrate the temperature data for each occupied cell over a decadal (10 year) period just as easily as as if it was a noisy single year period. Figures 1 and 2 shows how the icosahedral mesh is generated.

Figure 1. Generating a regular triangular mesh from an Icosahedron
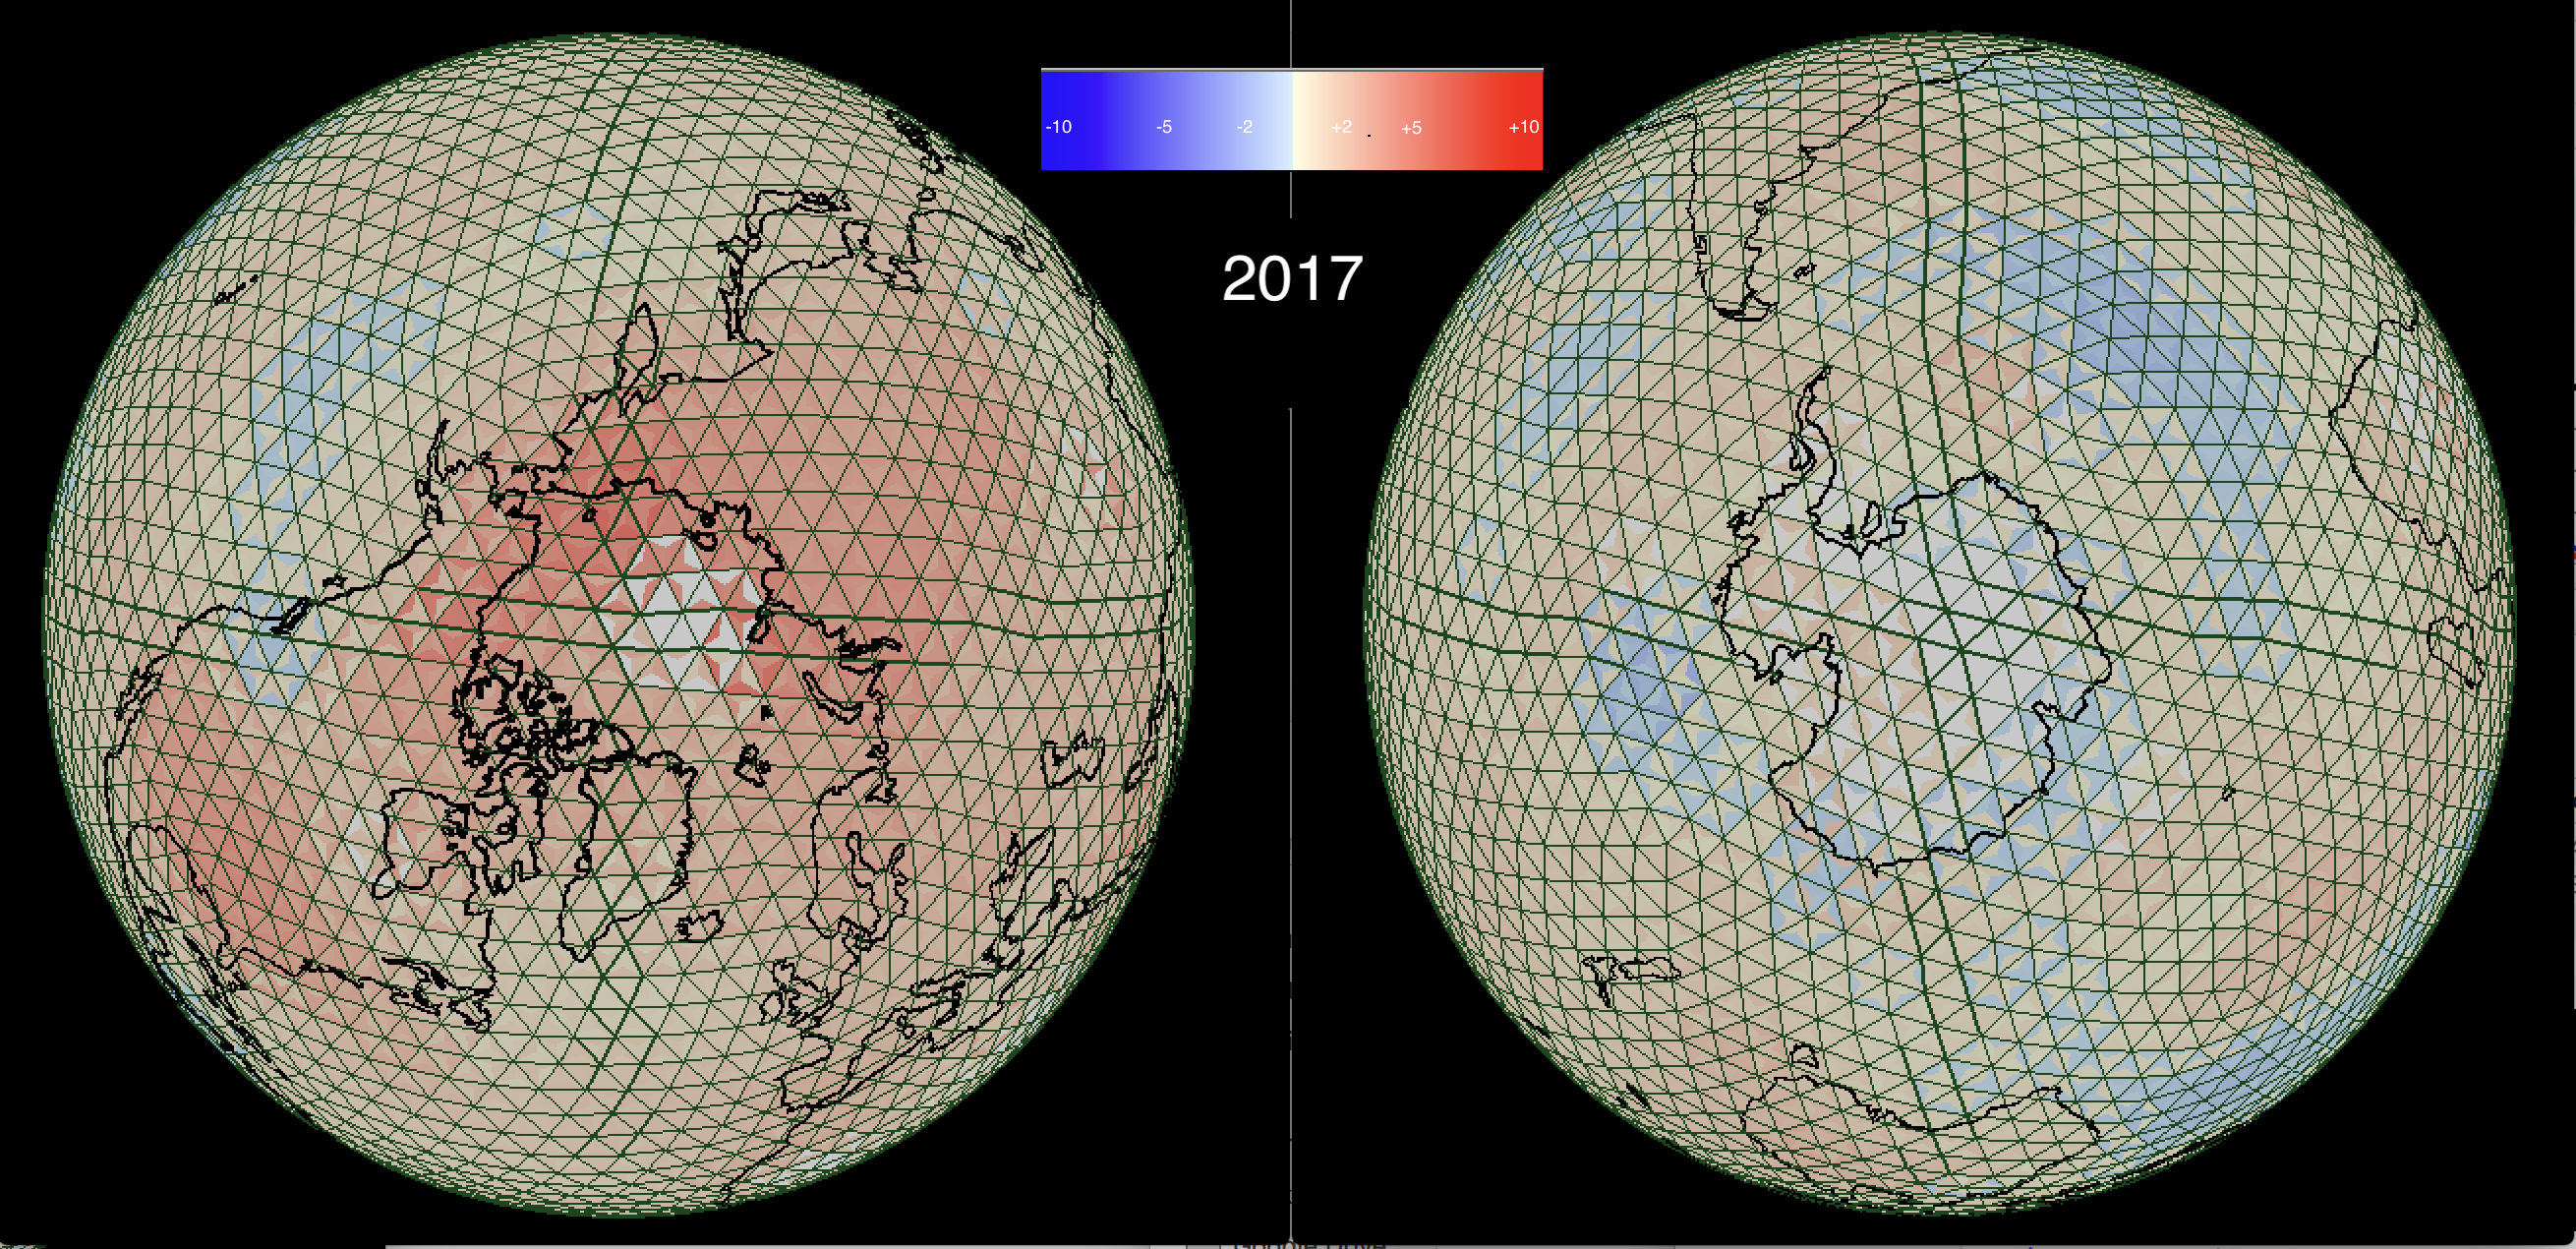
Fig 2. The Icosahedral grid used in this work is shown above, demonstrating how the poles are handled in a consistent way
The temperature data source used for this work is GHCNV4 for land data and HadSST4 for the Ocean temperature data. The decadal average simply averages all recorded temperature anomalies (on a 1961-1990 baseline) for each bin over successive 10 year periods. Hence we get the average global temperature anomaly for the 1960s, 1970s etc. These results are remarkably smooth because they integrate locally over ENSO and other short term affects. Figure 3 shows a comparison between the decadal results and the annual results showing just how effective the decadal averaging really is.

Fig 3. Annual temperature trends updated for October 2023 compared to the underlying decadal trends. The underlying trend is clearly identified.
These decadal temperatures can already be used to clearly predict that the Paris Agreement (to limit warming to 2C relative to pre-industrial temperatures) will be breached in 2o32.

Fig 4. The observed stable decadal trend shows that the Paris Agreement to limit warming to 1.5C since the preindustrial level (-0.5) will very likely be exceeded in 2032
This demonstrates how effective the decadal integration method is at isolating the underlying enhanced Anthropogenic CO2 greenhouse effect from natural background noise (ENSO etc.).
An example of the detailed temperature distributions for the 2011-2020 decade are shown in Figure 4 using spherical icosahedral binning.

Climate Sensitivity.
The “Transient Response” (TCR) is defined as the temperature rise after a doubling of CO2 levels averaging out other transient effects like El Nino and NAO. Therefore we can measure this by assuming a business as usual scenario with continuing carbon emissions, and project future CO2 levels based on the observed dependence of global temperatures on CO2 levels in the atmosphere. For this study we use the measured decadal temperature dependence and extrapolate this forward to 2100 compared to a similar extrapolation of CO2 trends as measured in Mauna Loa. The results are shown in Figure 2.

Extrapolation of decadal temperatures to a doubling of CO2 levels based on a continuing trend of the observed decadal temperatures
This result gives a Transient Climate Response of 2.9C with an estimated error of 0.o2C which is right on the line for early action. Remember that this is the worst possible case with no action taken to mitigate emissions until the end of this century. The scenario is also unrealistic because there are insufficient reserves of fossil fuels to maintain this pace, therefore we will anyway have to replace most of them anyway. The logical answer to our energy needs for the future is to develop further Nuclear Power and eventually Nuclear Fusion within the next decade.


You say: “This result gives a transient climate response of 2.4 °C with an estimated error of 0.02 °C. »
This is not what your painting presents.
The estimates of the anomalies, at 280ppm and then 560 ppm, are respectively -0.45°C and +2.45°C. A doubling of the CO2 rate would therefore correspond to about +2.9°C.
If you start from the estimate of the anomaly at 0°C, the CO2 level is at about 325ppm. It is therefore necessary to compare with the anomaly when the doubling reaches a rate of 650ppm. It’s outside of your painting….
An extrapolation of your curves leads to a doubling around the year 2130 and the anomaly would be about 3.2°C. Even higher….
Your extrapolations of the transient sensitivity would therefore be higher than those of the IPCC….
Of course it depends on the baseline definition. So you are right that if you take -0.5C as the lowest “pre-mass industrial” temperature and then add on 2.4C then you get 2.9C for the doubling temperature. Basically the natural temperature of the Earth is not well defined, but I think your argument makes sense.
Hi
Hi Clive:
I’m afraid that your excellent piece is marred by a mistake, please correct it.
You call TCS what in reality following your definition in the text is the ECS, Equilibrium Climate Sensitivity, sudden doubling of CO2 concentration.
The TCS is defined in a different way, and was introduced as a way out of the problem of the climate simulation community to narrow the range of values for the ECS, which has been rather large for several decades now (still is!).
“Transient climate sensitivity is defined as “the change in the global mean surface temperature, averaged over a 20-year period, centered at the time of atmospheric carbon dioxide doubling, in a climate model simulation” in which the atmospheric CO 2 concentration increases at 1% per year”
Please where does this definition come from ? (I can’t see a reference to 20 years in the IPCC report, which also refers to ECR calculation as theoretical, in which case an average atmosphere that point is not required)
Read table and not painting
As always excellent analysis. I was interested in your last paragraph where you say “The scenario is anyway unrealistic because there are insufficient known reserves of fossil fuels to maintain it.” I knew this back in the sixties. I was taught that as reserves diminish, price would rise exponentially and that there was the potential of collapse of our entire “civilisation”. Is it possible that CO2 has been used as an excuse to preempt societal meltdown by ensuring that alternative technologies are in place before oil is unaffordable? Edward Bernays never went for full frontal assault.
I was reading about crushed basalt the other day and how spreading it on agricultural land will improve fertility, but more importantly, has the potential to soak up billions of tonnes of CO2 annually. This should allow us to go net negative CO2, which is a wonderful experiment, since theoretically a reduction in CO2 concentration should lead to global cooling? If CO2 is proved to be the factor heating the atmosphere, we should be able to use basalt as a thermostatic control to maintain the atmosphere at its Goldilocks temperature – whatever that might be?
Is there any reason to think spreading crushed basalt on farmland will deliver better outcomes than spreading it on the ocean?
A good question to which I have no answer. I speculate that on a field surface more basalt is exposed to atmospheric CO2, whereas in the ocean it will sink and be unavailable to absorb. There is a wee experiment for someone. I see that the concentration of CO2 in sea water is close to that of the atmosphere, so perhaps columns packed with basalt could filter sea water?
Yes there are always doom mongers about. I remember the same stories in the 60s and 70s of society collapsing by running out of fossil fuels (coal). I also remember London Smogs when hundreds died each year and the buildings were caked in black soot. Now we all lead comfortable lives with low air pollution but worry instead about having slightly warmer weather !
There is a “basalt” power plant in Iceland so it seems to work !
https://eos.org/articles/basalts-turn-carbon-into-stone-for-permanent-storage
“Is it possible that CO2 has been used as an excuse to preempt societal meltdown by ensuring that alternative technologies are in place before oil is unaffordable?”
That’s been pretty obvious to those of us that study peak oil. Widespread depletion of crude oil (and other FF) is an EXISTENTIAL crisis to a comfortable way-of-life. The yellow jacket riots of France are evidence of what happens when the supply gets tweaked. OTOH, climate change is cast as something that can be controlled if we act to mitigate by getting off of fossil fuels. Thus the solution is the same, but with arguably less panic in the populace. AKA the #NoRegrets policy.
“This then allows us to directly measure the transient climate sensitivity, defined as the temperature increase on a doubling of CO2 from pre-industrial levels.”
Only by assuming that 100% of the warming is due to the increase in CO?, which is almost certainly a wrong assumption. It hasn’t been demonstrated that the warming is due to the increase in CO?. It is just a common belief.
Yes of course that’s true. There were past natural variations in temperature for example. Otzi. provided also insights on the glaciers during a little known warm interval in the last 10.000 years.
However recent warming probably is also due to human impact on the earth. That includes massive deforestation and even now covering the earth with Wind Farms !
I also worry about attributing all the upward slope in the smoothed temperature curve solely to CO2, when we are pretty sure there have been other things going on in the timeframe considered.
“Other things going on” could be either natural or manmade processes which have a timescale longer than the smoothing time of 10 years.
Natural processes which come to mind include, for example solar, planetary or other astronomical influences, with timescales greater than 10 years, or ongoing oscillations in the ocean/atmosphere.
Manmade processes include irrigation and extraction of ground water, which has been increasing over the same time period, and which we recently discussed in another thread and agreed must have an influence via atmospheric water vapour. There have also been big changes in land use in some regions, and ongoing growing heat island effects due to development and urban expansion nudging some of the measured temperatures upwards.
If the net effect of these other manmade impacts on the slope of the graph is positive, then all the current focus on CO2 and Net Zero seems unlikely to achieve the desired result.
I agree. Some of the warming must also be due to growth in of size of populations: Deforestation, Agriculture, Air traffic, Transport, Urban sprawl etc. This has accelerated. So this result is an upper limit.
“However recent warming probably is also due to human impact on the earth.”
“Probably” means nothing in science. Solar activity in the second half of the 20th century has been in the top 10% of the past 9,000 years (AR5). Just a coincidence? There’s a lot we don’t know about climate and that includes non-linear indirect effects of the changes in solar UV starting in the stratosphere and dynamically affecting polar vortex strength, the Earth’s speed of rotation, atmospheric circulation, and heat exchange between the Arctic and mid-latitudes.
The climate is extremely complex, and what we don’t know is not in the models. Assuming insignificant natural warming is a sure way of being wrong.
Laplace practicality invented probabilistic interpretations of physics. He also formulated the tidal equations that bear his name, which are the principle source of fluid nonlinearity in the Earth’s climate. Sunspot activity contributes little.
Of course that’s true but then only way to prove you are right (for example solar variability is the cause) would be for temperatures to enter a cooling phase. There may also still be some systematic effects in the data for example the pairwise homogenisation algorithm which does change the slope of the temperature data also through increasing urbanisation. Likewise the HadSST4 data reinforced ocean warming slightly.
We can argue the details but overall we must work with the “official” data we have.
Hello Clyde,
Very interesting. In a recent study on the science behind Net-Zero I found a slightly lower value of 2.74 based on a straightforward logarithmic fit of HadCRUT5 yearly temperatures and yearly Manau Loa concentrations. Here is the link to this study: https://www.wyniasweek.nl/wp-content/uploads/2024/08/WW-Hagoort-3-augustus-2024-BIJLAGE.pdf
Your value of 2.9 is close to the central value of the Equilibrium Climate Sensitivity (ECS), which ranges from 2.6 to 4 according to the recent IPCC AR6 report. 2.9 is clearly beyond the range for the Transient Climate Response of 1.4 to 2.2.
Incidentally, in the linked study I make the case for keeping global warming in check by limiting total yearly CO2 emission rates to a constant value. Some time ago you suggested the same policy based on your analysis of the Bern model. In the case of the 1,5 degree limit of the Paris Agreement, I estmated that CO2 emissions must be limited to 26 Gigaton/year.
Regards, Jacques Hagoort
I think you’re right that if CO2 emissions were stabilised, then the climate would reach an equilibrium value.
This is what happened in the Eemian when sea levels were more than 2 meters higher than today.
This is meaningless nonsense.
IT ASSUMES THE MEASURED SURFACE WARMING IS ACCURATE (it is not) AND THAT ALL WARMING WAS CAUSED BY CO2 INCREASES (ALMOST CERTAINLY NOT TRUE).
The scientific consensus is that lab spectroscopy of CO2 is a good start. That would be about +0.7 degrees C. warming from CO2 x 2. There are believed to be a variety of feedbacks that have net effects ranging from zero to 8x amplification of CO2 warming
This article makes no progress in defining the long term effect of CO2 in spite of what the author believes he has done.
The free articles here are rare and the quality is disappointing.
I have decided to delete this website from my bookmarks list.
What caused the pause from 1940-1970 and can you assume it won’t happen again? Could there be longer-term transient effects that we don’t yet know about?
Usual answers include : Pollution especially smoke from coal. CFC aerosols now banned
Climate sensitivity continues to be a guesswork.
Most of the warming since 1983 (sattelite era) comes from global brightening, thinning of clouds.
We don`t know how much of this reduced cloud cover is a feedback process.
How do CO2 have impact on the short wave radiation that has resulted in most of the global warming the last 40 years?
The traditional greenhouse effect (reduced longwave radiation out at TOA) from greenhouse gases is inverted. CO2 has the opposite effect, with longwave cooling, in the climate budget.
So much more interesting than temperature is the question if clouds will disappear from the sky. Then we should have 5 degrees C more warming. All discussion of climate sensitivity is bullshit if you can`t answer the fate of clouds.
It’s not just clouds ie albedo changes but also water vapour to consider. Some effort to quantify this has been attempted here. https://watervaporandwarming.blogspot.com/2019/11/abstract-during-time-periodwhen-water.html?m=1
I’m surprised no-one ever mentions the thermal effect of our energy consumption, building and land use change. If I got my facts right (feel free to challenge) –
Annual global primary energy consumption in 2023 was c. 180,000 Terawatt hours.
The volume of the Troposphere is c. 6,644 million cubic kilometres.
The thermal effect of 180,000 Terawatt hours on a volume of air of 6,644 million cubic kilometers is approximately a 0.081 degree Celsius temperature increase.
If the average conversion to thermal energy is say 80%, the temperature effect would be 0.065 degrees Celsius.
There is also the thermal effect of urban heat islands and other land use change.
The distribution of this energy within the volume affects the temperature. There is probably a strong thermal gradient biased towards the Earth’s surface.
Being an annual effect, to what extent does it accumulate?
It would be interesting to know if anyone has done research to determine a more precise effect. All the attention at the moment seems to be on the CO2 greenhouse effect.
Take the EEI (eg from Wikipedia) and multiply by the surface area of the earth. Now compare it to total human energy production. It dwarfs it
So, basically, you have averaged the temp over 10 years to flatten out anomalies in a super clever way? So helpful. Much appreciated.
And what would be super cool now is figure out what is causing the signal that is left.
Best guess at the moment is probably AGW ?
Ideas for other factors extending over longer periods :
Long-term insolation variations
Combined Milankovitch cycles
Ocean degassing (release of CO2 with heat) ?
The main point is that this procedure measures directly the decadal temperature change since pre-industrial times on a fixed grid. This grid is a 3D tessellation of the globe which avoids interpolation.
So yes AGW has had a smallish effect on global average temperatures. This includes deforestation, population growth, urban sprawl etc.